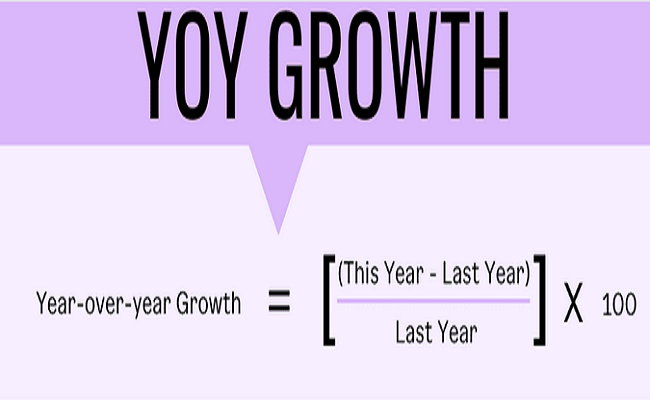
Year over Year (YoY) is a sort of financial research that may be used to compare series data for a particular period. With YoY analysis, analysts can detect the relationship between various company factors' quantity or quality change. Investors in finance typically examine the performance of investment products year over year to see whether or not they are functioning as predicted. This method is very beneficial for determining growth trends over time.
Rationale Behind YoY
When examining a company's performance, YoY comparisons are common because they assist in minimising seasonality, which may be an issue in most industries. While many lines of business get a peak period and just a low demand season, sales, profitability, or otherwise other financial indicators fluctuate at different times of the year. For instance, during holiday sales, which occurs mostly in the year's final quarter, shops see a surge in demand. Annual comparison of sales and profitability is an excellent way to gauge a business performance. Compare this year's fourth-quarter results with those from prior years.
It may seem that a shop is enjoying outstanding growth when comparing fourth-quarter results to the prior third-quarter statistics, but this variation is attributable to seasonality. There may seem to be a large reduction in quarterly sales when evaluating the fourth quarter to the first quarter of the following year. This may be due to seasonality.
Investors who want to see growth as a straight line may prefer the term "sequential," which links one quarter or month to the prior one. A tech company's fourth-quarter phone sales or an airline's January-December ticket sales might be used as examples.
Common YoY Indicators
The following is a list of all the most regularly used year-over-year comparability metrics:
- What is the current state of inflation?
- What is the trend in unemployment rates and labour participation rates?
- Gross domestic product (GDP) measures how much a country produces?
- Interest rates if we're in a period of growing or declining interest rates?
Advantages of YoY Analysis
Marketers use year-over-year results to accomplish the following outcomes:
- Objectifying volatile values may be done by comparing overall results.
- It is feasible to lessen the impact of seasonality on projections by comparing multiple static points of time.
- In order to make comparisons and draw inferences, the findings are provided as percentages.
- Provides a basic computation that most people can do.
How to Calculate YoY?
1. Choose a Measure from which you may calculate YOY Values
Whenever applied to a variety of indicators, YOY may be pretty useful. Companies frequently compare revenue year over year, and they can also use any data that appear on a financial statement. Earnings Before Interest and Taxes (EBIT), economic value-added, money supply, liquidity ratio, and other measures are included. Select each or maybe more subsets of YOY numbers that will help you reach the most informed conclusion regarding your company or investment.
2. Subtract Two Data Points that Apply
Subtracting the two numbers once you've chosen the data sets you want to utilise. The discrepancy of the numbers is the result of the formula, which will be converted into such a ratio in the following step.
3. Divide Difference
Using your initial equation, evaluate the differences between the actual years and the prior year's. You must get a decimal response as a result of this.
4. Decide on a Percentage
To get your %, move the decimals to two points to the right. Based on the quantity of accuracy desired, you could round the percentages to the nearest whole number or operate in decimals.
There are just four simple steps to calculate YoY analysis. But wait! It isn't as simple as it looks. It definitely requires technicalities. To learn all this properly, you should join a stock market course. The Thought Tree provides one of the best courses that will help you learn YoY and other important things you need to learn.
Conclusion
These are some of the simplest ways to evaluate if a company is expanding or shrinking, and one of the simplest ways is to look at year-over-year comparisons. Stocks that are expanding are typically better investments since companies tend to raise their revenue and profitability over time, leading stock values to climb. Companies with diminishing sales and profitability, but on the other hand, tend to suffer big drops in their stock values.
To summarize whatever has been explained so far, YoY is the statistic used to evaluate growth over the previous 12 months as year-over-year growth. YoY is a useful metric to use when examining businesses or economies to adjust for the impacts of volatility.
Although this is a valuable statistic, it falls way short of portraying the full picture since it leaves out important details. This figure could be used to spot tendencies that point to a coming economic slump.
